Using the GUI#
The GUI includes a toolbar and several windows:

The toolbar#
Load#
Load a new recording. Accepts .h5, .abf, and .dat files.
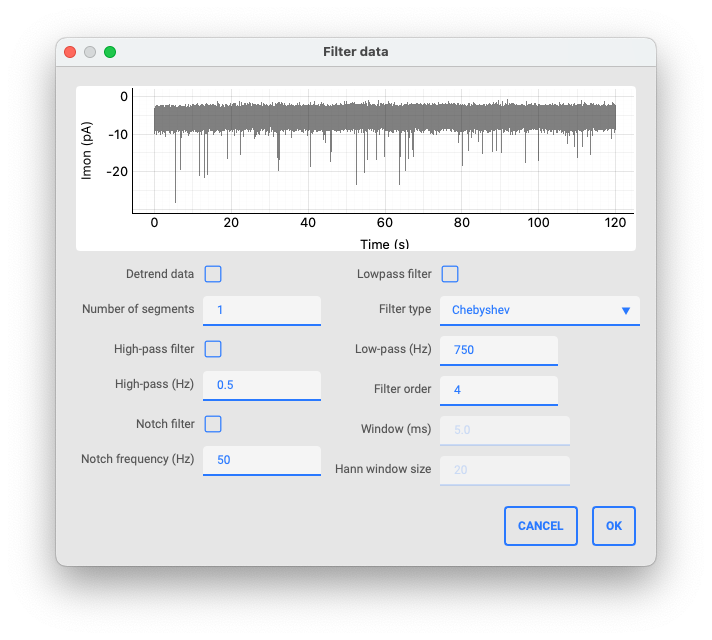
Filter#
Apply filters to the recording. Includes options to detrend the data, filter the data using high-pass or different types of low-pass filters, and apply a line noise filter. The raw data is displayed in gray and a preview of the filtered data is shown in yellow upon selection of either filter option. Detrending, high-pass, and line noise filteres are applied before any low-pass filter. To remove line noise, spectrum interpolation is used. Low-pass filtering is based on a forward-backward approach using a Butterworth filter.
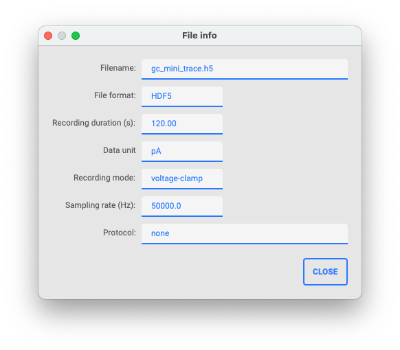
Info#
Display information about the trace and file.
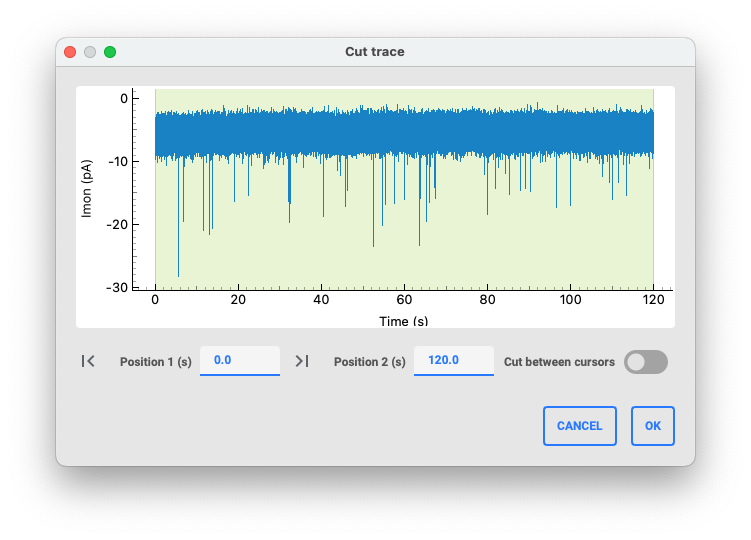
Cut#
Cut the data trace. Start and end of the selection can be adjusted by dragging the cursors or by specifying a time. By default, data not selected at the beginning and end of the recording will be cut out. Toggle the ‘cut between cursors’ button to cut out the data between the cursors instead.
Reload#
Reload the current recording.
Analyze#
Run the miniML analysis on the current recording.
Prediction#
Toggle display of the prediction plot.
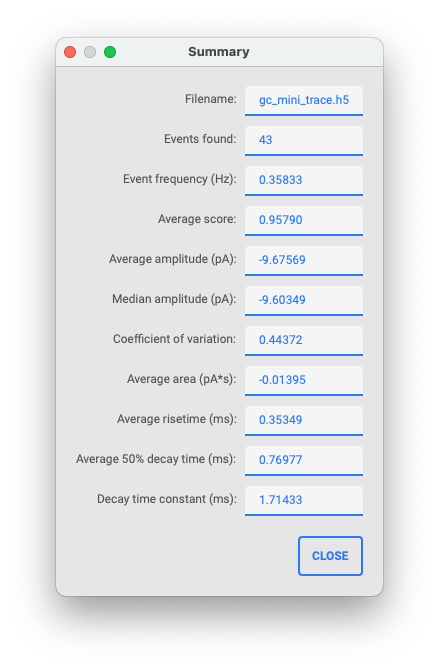
Summary#
Show summary statistics for the analyzed recording.
Event graphs#
Toggle display of the event graphs.
Event table#
Toggle display of the event table.
Event viewer#
Display the event viewer window after an analysis. This allows inspection of individual events and deletion of events.
Save#
Save results to file (as .csv, .h5, .pickle).
Auto settings#
Open the auto settings tool to determine optimal settings for event detection.
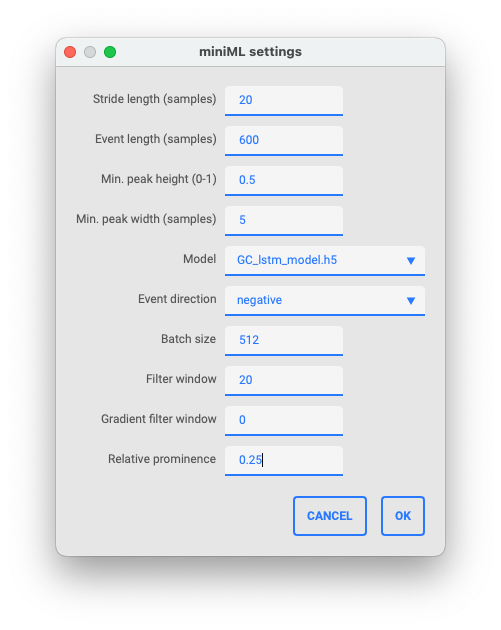
Settings#
Opens the settings menu.
Tip
The default values of the settings can be changed in the miniml_settings.py file.
Plot windows#
Prediction plot#
Here, the model inference trace is shown after analysis.
Trace plot#
This is the main plot window. It shows the recording and the detected events overlaid (after analysis).
Event plot window#
Shows all detected events overlaid.
Average plot window#
This window displays the average event waveform after analysis.
Amplitude histogram window#
This window shows the histogram of event amplitudes for the analyzed recording.
Event table#
This table lists all detected events with their location (in seconds), amplitude (in data y units), area (in data y units x seconds), risetime (in seconds), and decaytime (in seconds). Individual events can be right-clicked to either inspect the event in the main plot windows or delete the event from the analysis.